
Study summary

Introduction

The Study summary tab provides an overview of your survey's data collection progress.

When a survey is created under a plan with record limitations, such as free or academic plans, complete records are given priority. For example, a free plan is limited to analyzing data from 50 respondents. Your summary page may initially show a mix of record statuses, but Discover will replace other statuses with complete records up to your plan's limit.
Finalized records chart

This chart summarizes all finalized records — respondents who have reached a survey ending or been marked as expired and cannot reenter the survey.

A sample status chart with bars for completes, incomplete, and disqualified.

Complete

Respondents who started and finished the survey by reaching a survey ending configured with a Complete status.

Disqualified

Respondents who were directed to a survey ending configured with a Disqualified status.

Over quota

Respondents who reached a survey ending configured with an Over quota status. Direct respondents to this ending using the Skip over quota respondents to dropdown at the bottom of a quota element.

Expired

Respondents who did not finish the survey are marked as incomplete. Expiring their record finalizes it for use in analysis and downloads.

Incomplete records chart

This section shows the total number of incomplete respondents — those who started the survey but have not yet reached a survey ending. Incomplete respondents can return and finish the survey at any time. To finalize their records for analysis, expire them. Once expired, they cannot return to the survey.

Incomplete Records Chart

Quota summaries

Quota summaries appear at the bottom of the Study summary page and include two pieces:

  • A quota overview showing total progress, calculated by summing all group counts and limits.
  • A chart of quota group assignments, where each row sums to 100, similar to a multi-select question.
The summary for the region quota includes bar charts with some text details such as count and limit.

Study summary dashboard

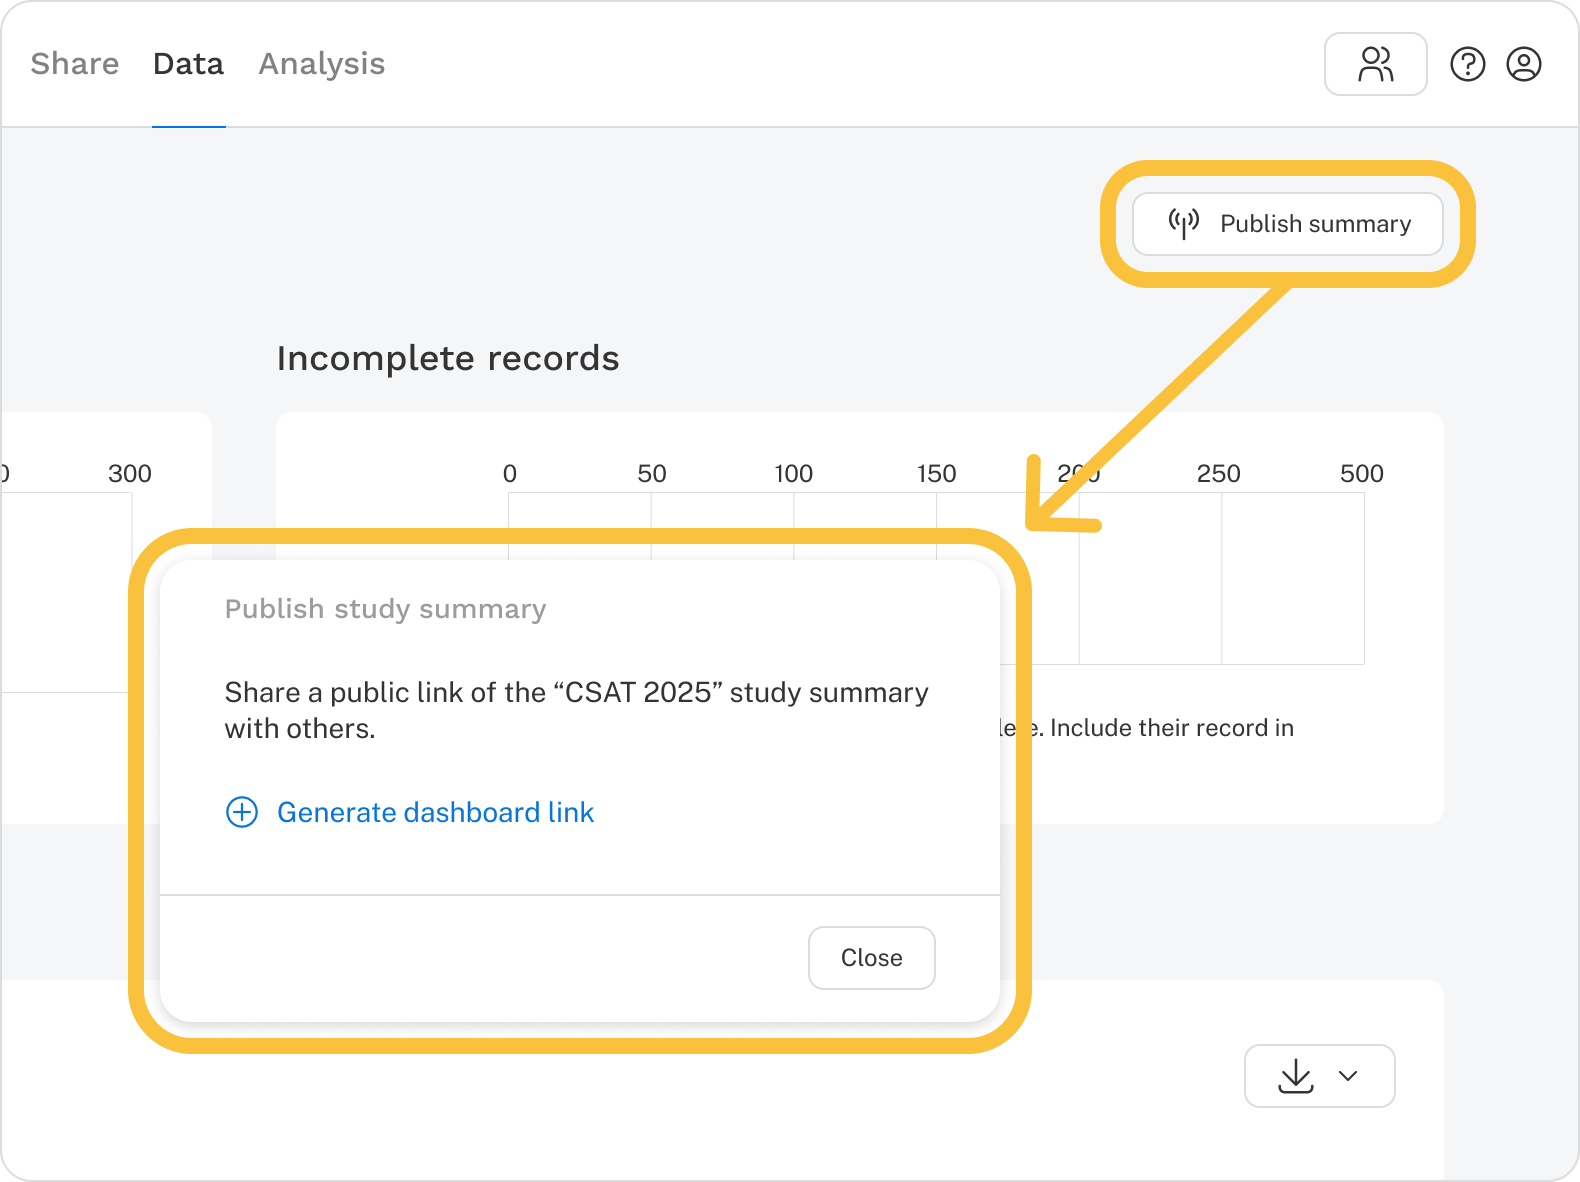
To share your survey and quota counts — for example, with a panel company — click Publish summary in the upper right corner of the Study summary page. This opens a modal where you can generate a public dashboard link.

Publish Study Summary dialog in Discover
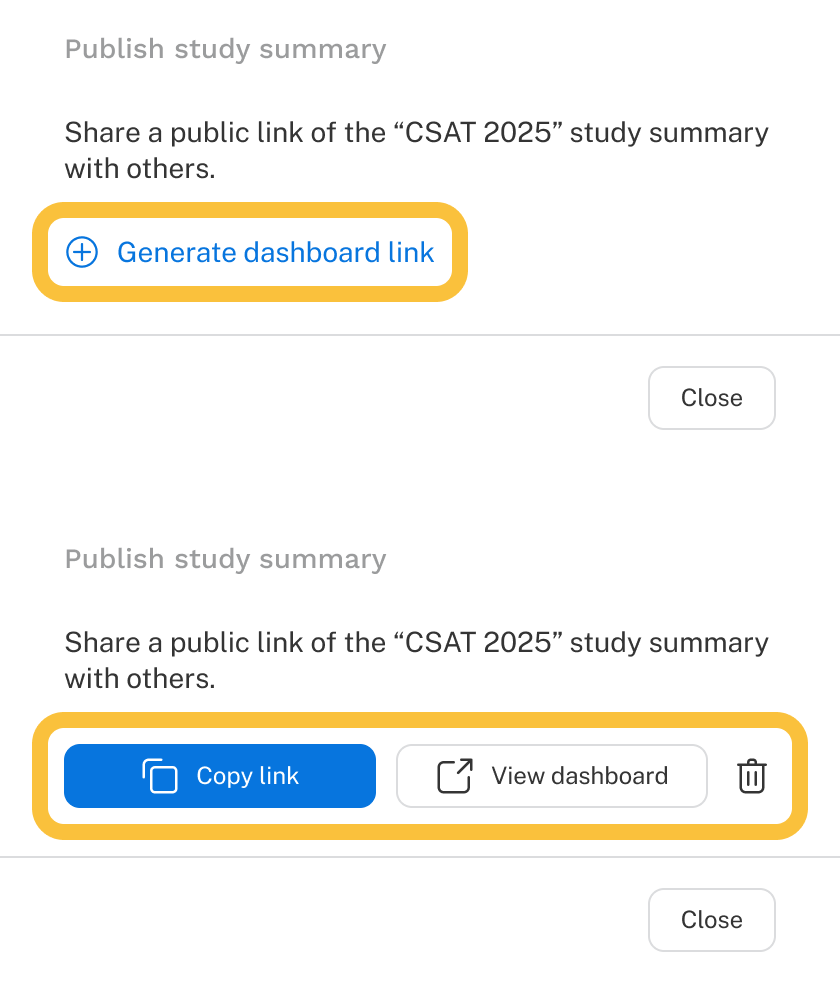
  1. Click Generate dashboard link.
  2. Click Copy link to copy the link to your clipboard, or View dashboard to open it in a new tab.
Generate Summary Dashboard Link dialogs

Security and deletion

The dashboard link is public — anyone with the link can access it, so share it with caution. If the link is no longer needed or becomes compromised, click the trash icon in the Publish study summary modal to delete it. Deletion immediately disables access. Any newly generated links are unique and distinct from previously deleted ones.